Finding Bullpen Solutions Without Making Roster Changes
- Steve Nagy
- Aug 27, 2020
- 5 min read
Updated: Nov 2, 2020
What should a struggling team do when they can’t seem to get any positive results out of their bullpen? In college, teams are limited to their set rosters in-season, whereas MLB teams can look both within the organization and externally for solutions. No matter the level, colleges can’t just mail in their season, and pro teams put a lot of money and prospects on the line by making acquisitions. So rather than being “stuck,” there has to be alternative ways to solve bullpen problems.
We have learned more and more about how pitch sequencing matters within a single at bat, but what if pitchers can be sequenced in a similar fashion throughout a game to be placed in the best position to succeed and perform better than they otherwise would have? This is a similar idea to having “different looks” out of the bullpen, but Kevin Kelly and I dove into these actual differences in search of how to improve a bullpen without having to do anything too drastic from a roster management standpoint.
Quick Background
This thought first came to me when Kevin pitched for us at JMU. While he was a starter most of his career, he was a much different “look” than the rest of our staff. He throws from two slots and has five different pitches between them. We typically had the same reliever follow Kevin every outing (at least during his junior year), and I started to wonder if one of the reasons that reliever was performing so well, other than having plus stuff on his own, was because he was a much different “look.” Kevin was not only drafted by the Cleveland Indians in 2019, but he is also one of the most cerebral players out there. In addition to dominating on the mound, he made the President’s List multiple times for excelling as a Computer Science major, and he was able to fill many of the gaps I struggled with when it came to answering this question.
Version 1.0
The more we got into this, the more we realized how many ways in which we can continue to make this better and better. We decided it would be best to start simple and see if there was a relationship at the highest level using wOBA against as our performance indicator.
We decided on wOBA against rather than ERA or a version of FIP because we were looking into performance outing by outing, rather than a larger sample size where ERA/FIP might make more sense. Then we compared reliever performance following one starter to the next. For example, how does Aroldis Chapman’s average wOBA against fluctuate in games when CC Sabathia starts compared to when Masahiro Tanaka starts? After that, we found the differences in their Statcast data. More specifically, differences in release height, release side, velocity and movement for each pitch type.
Initially, we found no relationship between wOBA and the differences we looked into. Getting more granular with this could change that in the future, but there are still useful applications of this now.
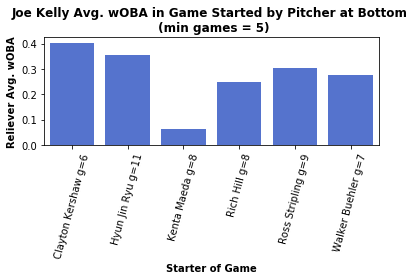
Application #1: Putting your reliever in the best position to succeed. Joe Kelly performed way better in games started by Kenta Maeda in 2019 than Clayton Kershaw. We did not spot any specific reasons as to why, so this could be a fallacy. But it could be worth continuing to trot Joe Kelly out there on days Maeda starts (had the Dodgers known this in 2019, Maeda plays for the Twins now).

g=6 means that Joe Kelly appeared in 6 games in which Kershaw started in 2019.
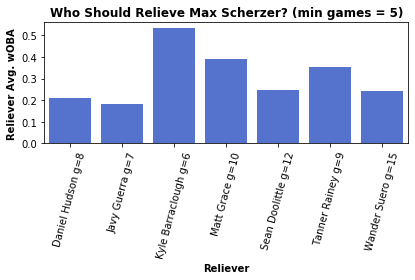
Application #2: Knowing what reliever’s have performed best following a specific starter. If I'm the Nationals and I have to choose between Javy Guerra and Kyle Barraclough to enter after Scherzer, I'm going with Guerra.

So even though there was no statistical significance (most significant correlation was .019, which means no relationship) in terms of the differences we looked into, teams could still use these charts to their benefit because it’s quite possible that 1) we did not consider something important and 2) some things are impossible to quantify. Maybe a reliever performed better than he normally does following a certain pitcher because he was so locked into that pitcher’s performance and he found himself analyzing opposing swings more during the game as opposed to being distracted for a starter who moved at a snail's pace and couldn’t find the zone. Who knows?
One team that has been catching some serious heat this year for their bullpen performance is the Phillies. I hate to be inconsistent with how I evaluate a bullpen because I used xFIP in this post earlier this week, but I feel there is an exception here. The Phillies bullpen is a full 2.2 earned runs worse than the second-to-last ranked bullpen in ERA. While they do appear likely to improve due to a couple recent trades and some indications of bad luck (high BABIP, middle of the pack in xFIP), is it possible they could be using their bullpen more efficiently?

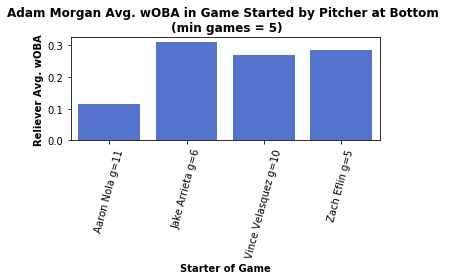
Above is an example of how Adam Morgan performed best in outings where he followed Aaron Nola. Morgan’s overall average wOBA against in 2019 was .267. In outings in which Nola started, it was .115. In 2020, Morgan has appeared nine times. None of them are in the same game as Nola. There could be a few reasons for this. Nola has been so good that the Phillies have gone to their expected top relievers when his outings are complete. But maybe it’s time to view “top” relievers differently and put Adam Morgan into the game following a Nola outing.
Limitations and Future Research Ideas
I was personally hoping that there would be more of a relationship between the differences we looked into and performance because that could open all sorts of doors in terms of in-game strategy and acquisitions on the pro side, but Kevin made a good point that it is still valuable to know there is not a relationship that we can see. Maybe the idea of building a bullpen around “different looks” holds no truth, that’s valuable to know.
Something else to consider: Relief outings are so short and irregular that there are many variables to account for, such as the rest time since the reliever’s last outing or even just the skill of the hitters he faces (e.g. facing the 3-5 hitters versus facing the 7-9 hitters). Sample size issues are a huge problem when analyzing relievers, since they tend to have short careers and generally throw around 80 innings at most in a year. Determining whether some relievers genuinely do better after certain starters will require more advanced analysis, such as clustering pitchers based on certain characteristics (such as arm angle, velocity, pitch arsenal, etc.) to get a larger sample size, controlling for the batters’ skills as well as the starter and reliever’s skills, and only using wOBA values for batters that the starter and reliever both faced.
Other areas we will continue to look at in finding a relationship include usage rate differences from starter to reliever and how far removed the reliever is from the starter (middle reliever compared to closer),
Lastly, swapping wOBA for xwOBA or another metric could turn up some different results. This is for teams to decide and for them to measure what they believe matters.
Thanks again to Kevin Kelly (@KevinKelly252) for all his input. He will have a successful career in a front office after he collects some MLB service time, if he wants it.


Comments