Roster Construction: Is Consistency The Key?
- Steve Nagy
- Oct 3, 2020
- 2 min read
Watching the Rays compete year in and year out despite having one of the lowest payrolls and lack of star players made me wonder how exactly they continue to compete at such a high level. Does their front office focus on filling their roster with depth over stars? The lazy answer is yes, because they simply cannot afford to pay the stars unless they are homegrown or developed into stars after an acquisition. This made me wonder if all teams should explore (if it is not already emphasized) compiling a roster of similarly-talented players, rather than one of top-heavy performance.
Hitters needed 80 plate appearances and pitchers needed 30 innings pitches to qualify. I did not want to include relievers because their WAR can be misleading and I wanted to include players who played enough to not throw off the distribution.
The first way I tried to determine this was by looking into the relationship between an entire team's standard deviation of WAR and their win percentage.

There's not much of a relationship here. Had my initial question been "true", the better teams would have been stockpiled to the left of this chart and north of .500 with a downward slope to the worse teams. It's no secret that teams like the Orioles and Rangers did not have great seasons, having a low standard deviation in roster WAR just tells us that their performance was consistently poor across the board. The Indians and Braves (the jumbled mess furthest to the right) had the most volatile performances on their roster but each had win percentages of .583. Freddie Freeman and Jose Ramirez can be thanked for that, both posting 3+ wins.
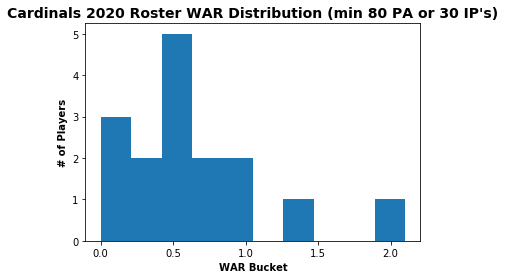
To visualize how two playoff teams on either end of the spectrum differ in the composition of their lineups, here's what the Cardinals and Indians overall Roster WAR distributions look like.


The Cardinals roster was more focused in the 0-1 WAR range, whereas the Indians had more variance in how their WAR was distributed. Since there was no relationship overall, I wondered if separating position players and pitchers would add any insight.

Still no clear relationship among starting pitching staffs and their consistency throughout the rotation. Playoff teams fall on both ends of the spectrum. How about position players?

A slightly more significant relationship here, in the opposite direction I was attempting to find. Teams with more variation in their lineup performance performed better. Another way to put this is that the teams getting more production (measured by WAR) out of their position players were more "top-heavy" than teams getting less production.
Intuitively, this all makes sense and was my initial gut-feeling before thinking about how the Rays do it. Teams need at least a couple of top performers to carry the team. Maybe this could prove to be more interesting over a full season, but for now, nothing too groundbreaking.
(Here's how the Rays "did it" in 2020.)


Comments